These are the data used by State Climate Office and other SCDNR staff in the assessment of the preciptation and flooding that occured the first week of October, 2015 across much of South Carolina, and for the associated Story Map. Please direct any questions to the SC State Climate Office.
Peak stage and streamflow data for 18 gages across the state. Four (4) gages recorded new record flows. Three (3) recorded flows in the top three peak annual flows on record. Data are from USGS, original report can be found here. Includes comparisons of this event to previous records. Refer to the report for details on the analysis from which these data were calculated.
View Data Table Download CSV View ArcGIS Online MapRecord preciptation values at weather stations across South Carolina for four record categories.
Precip data were obtained from NOAA Regional Climate Centers xcACIS and CLIMOD. Station names can be used as IDs to find more information individual stations and records.
Daily precipitation Totals for selected stations across South Carolina. Includes 20 stations.
View Data Table Download CSV View ArcGIS Map View ArcGIS Online Feature LayerPrecip data were obtained from NOAA Regional Climate Centers xcACIS and CLIMOD. Station names can be used as IDs to find more information individual stations and records.
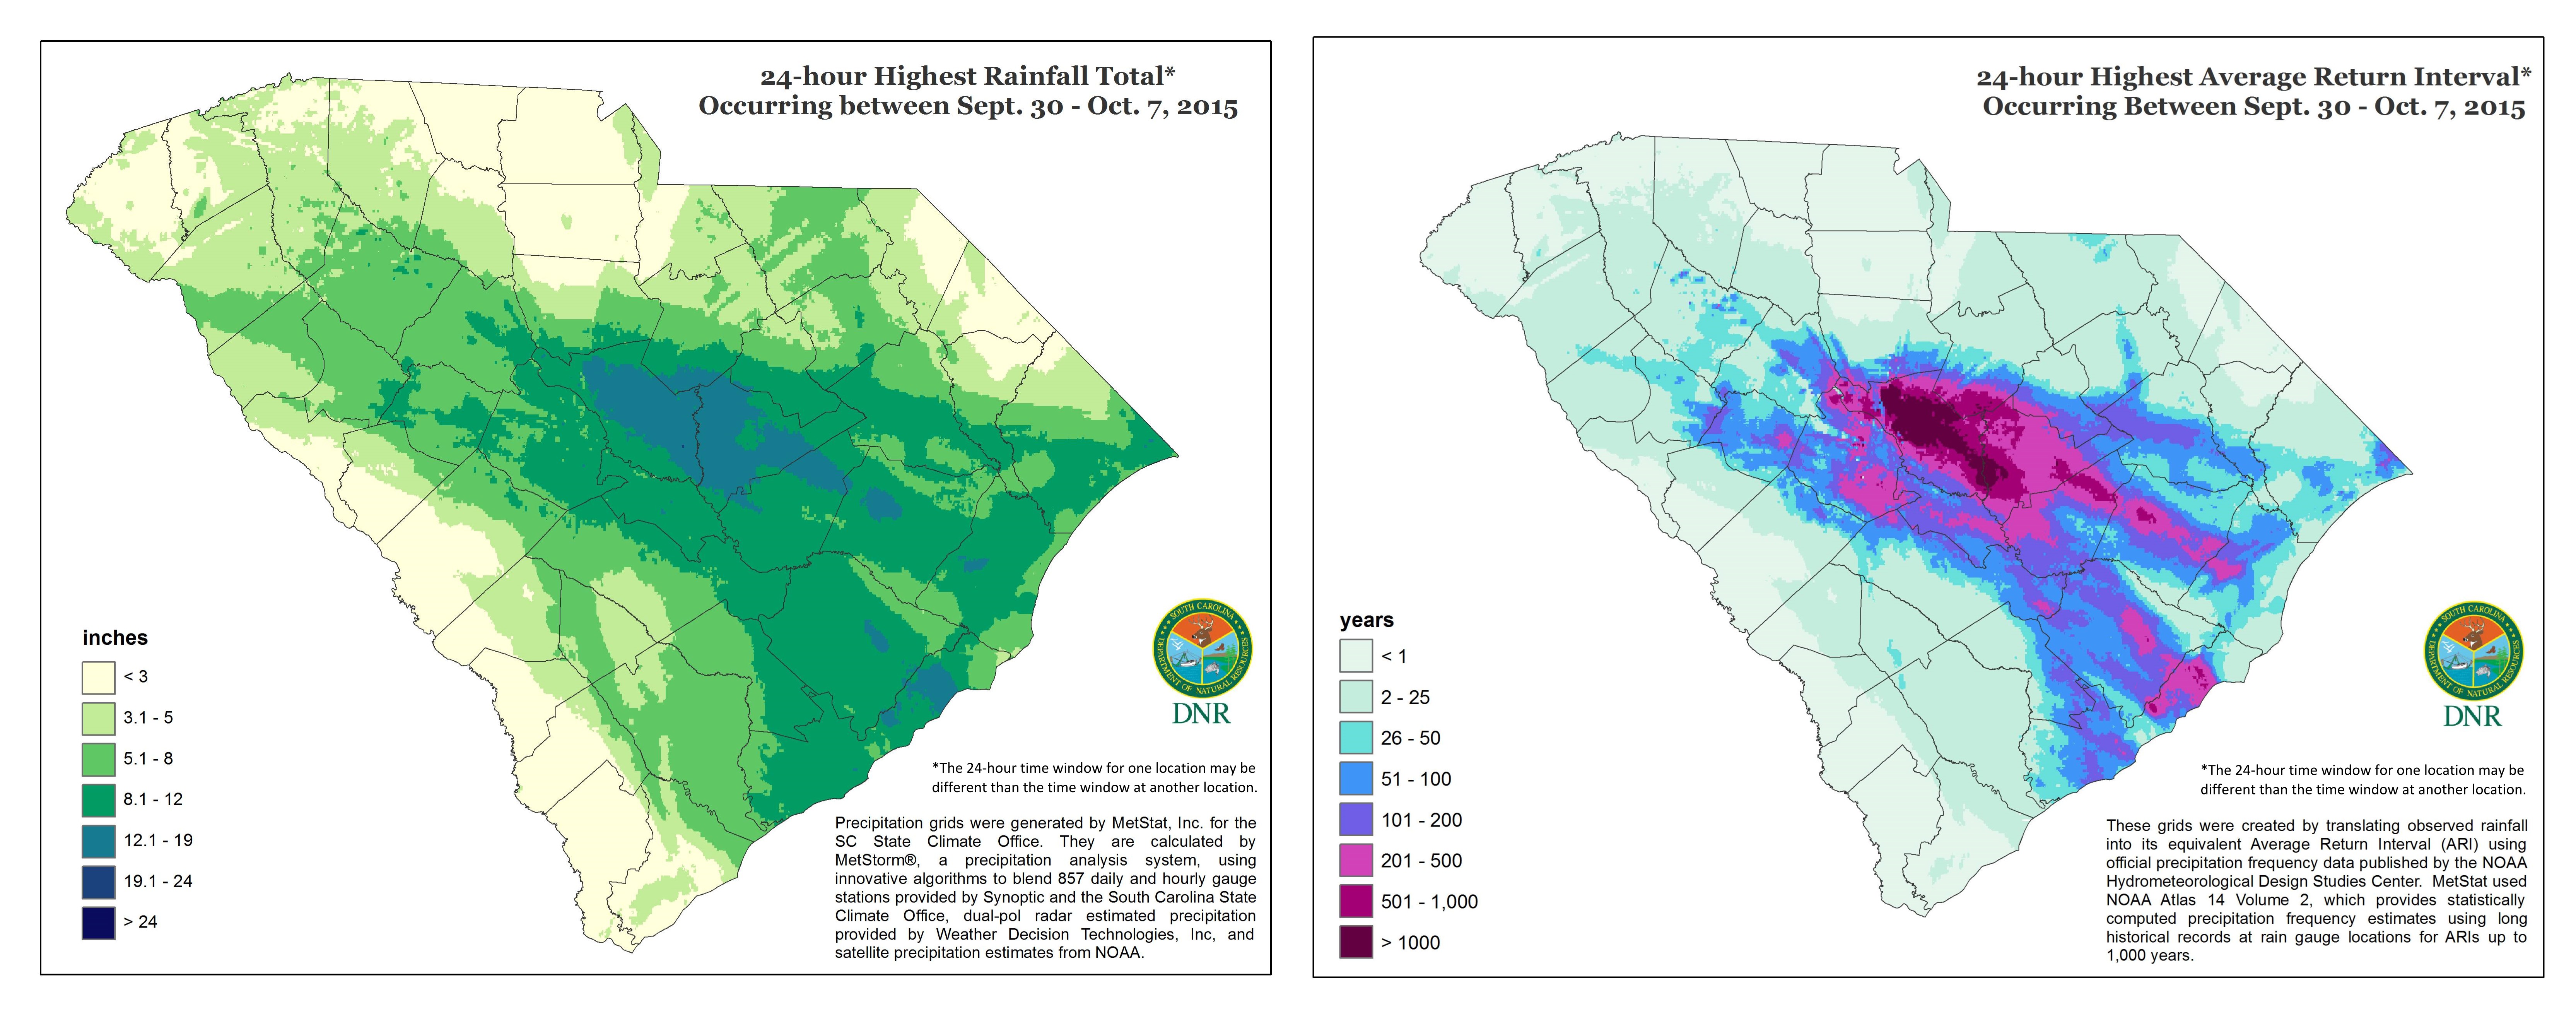
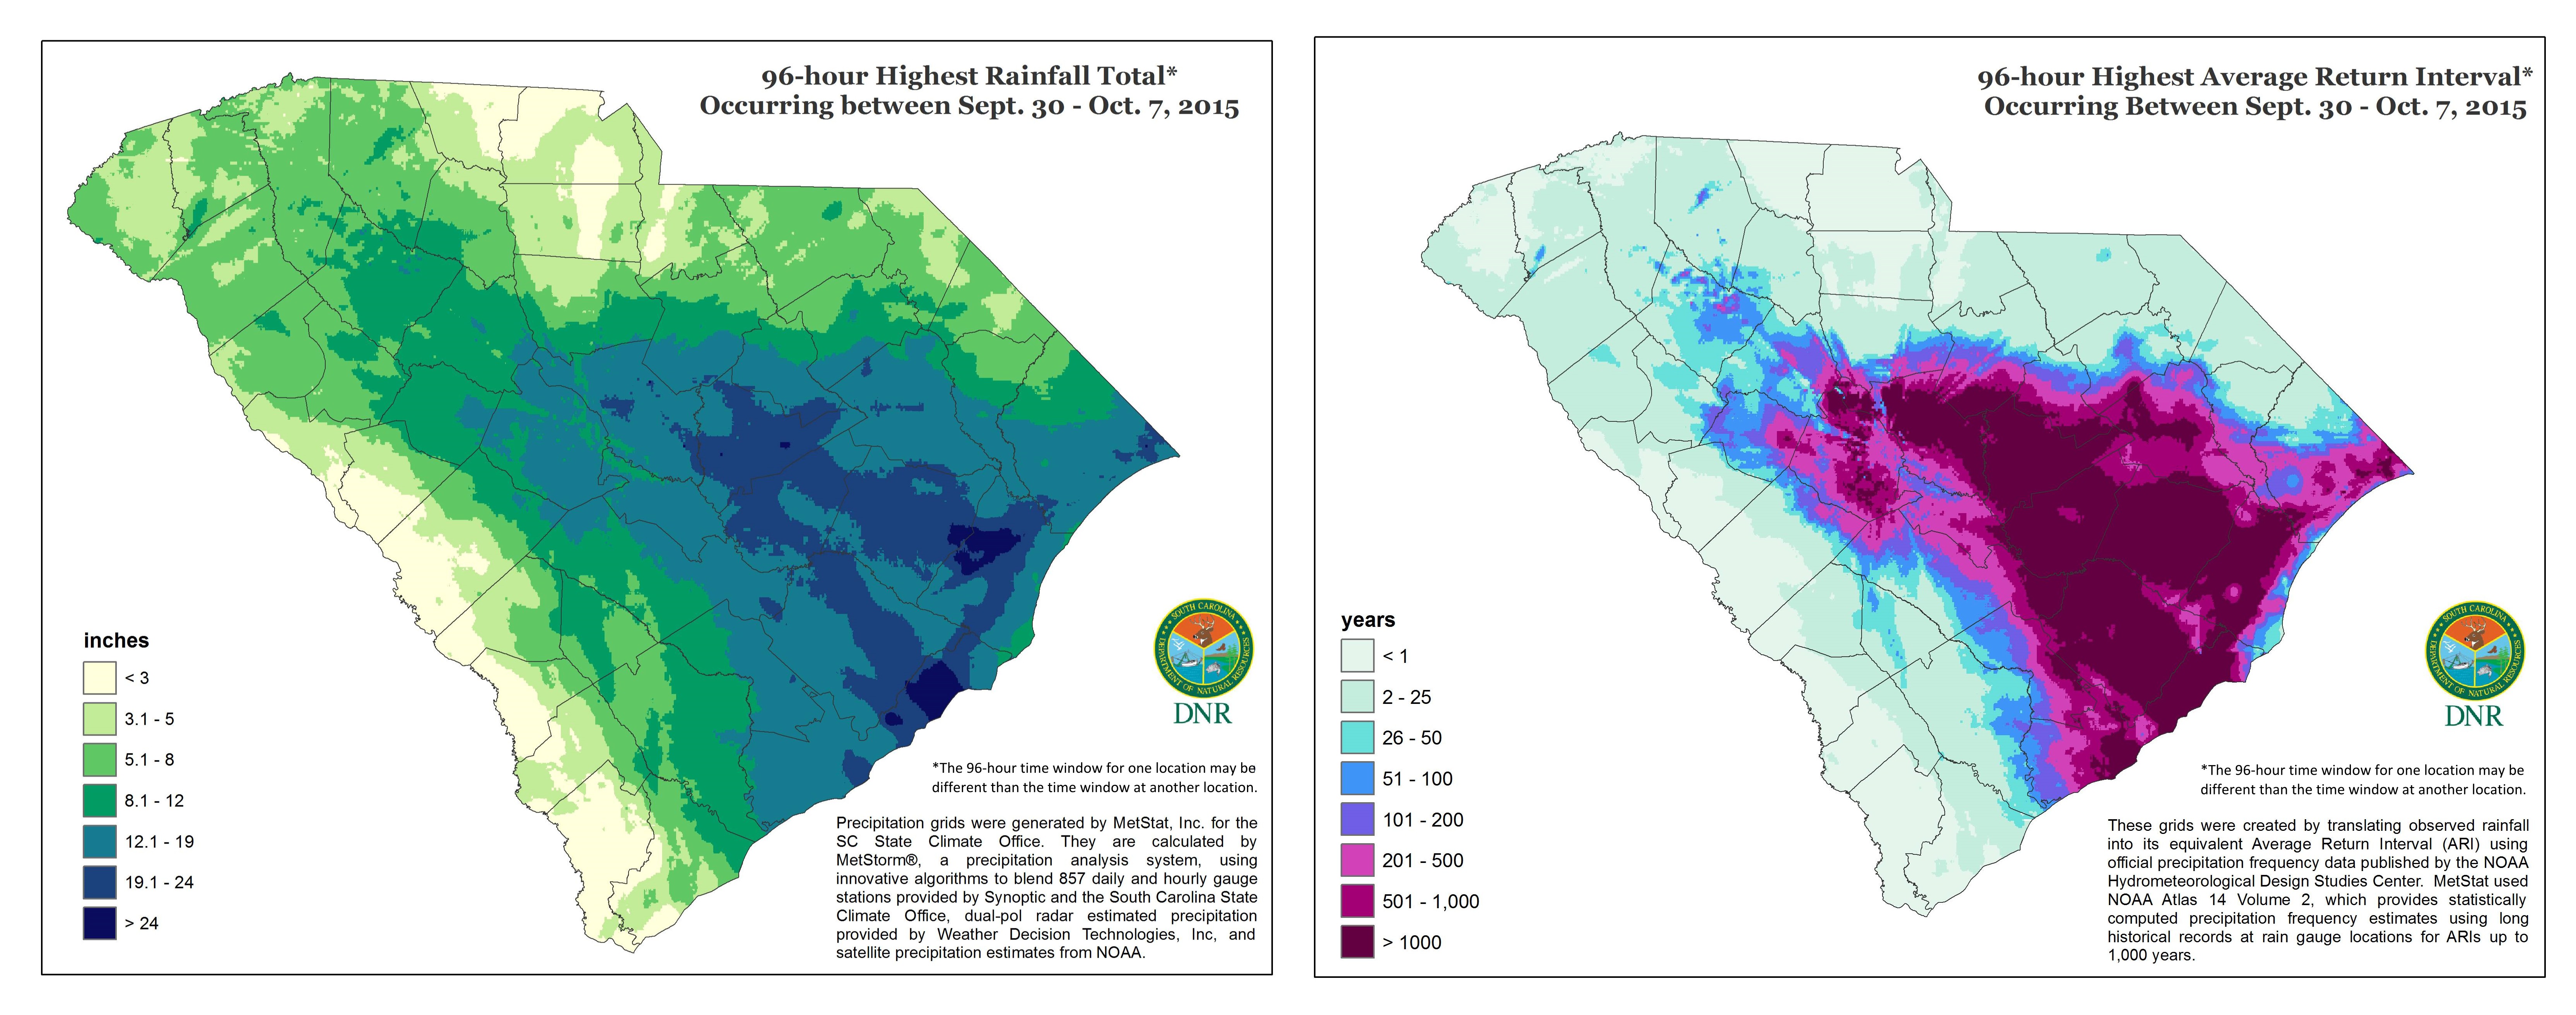
Precipitation and Average Return Interval grids were generated by MetStat, Inc. for the SC State Climate Office. They are calculated by MetStorm®, a precipitation analysis system, using innovative algorithms to blend 857 daily and hourly gauge stations provided by Synoptic and the South Carolina State Climate Office, dual-pol radar estimated precipitation provided by Weather Decision Technologies, Inc, and satellite precipitation estimates from NOAA. Grids were generated for the maximum 6-hr, 24-hr, 48-hr, and 96-hr periods during the event. The maximum refers to the maximum amount for each grid cell. For example, the max 24-hour time window at one location may be different from the 24-hour window at another location. Click to view maps larger.
6 hour 24 hour 48 hour 96 hour Storm event total precipitation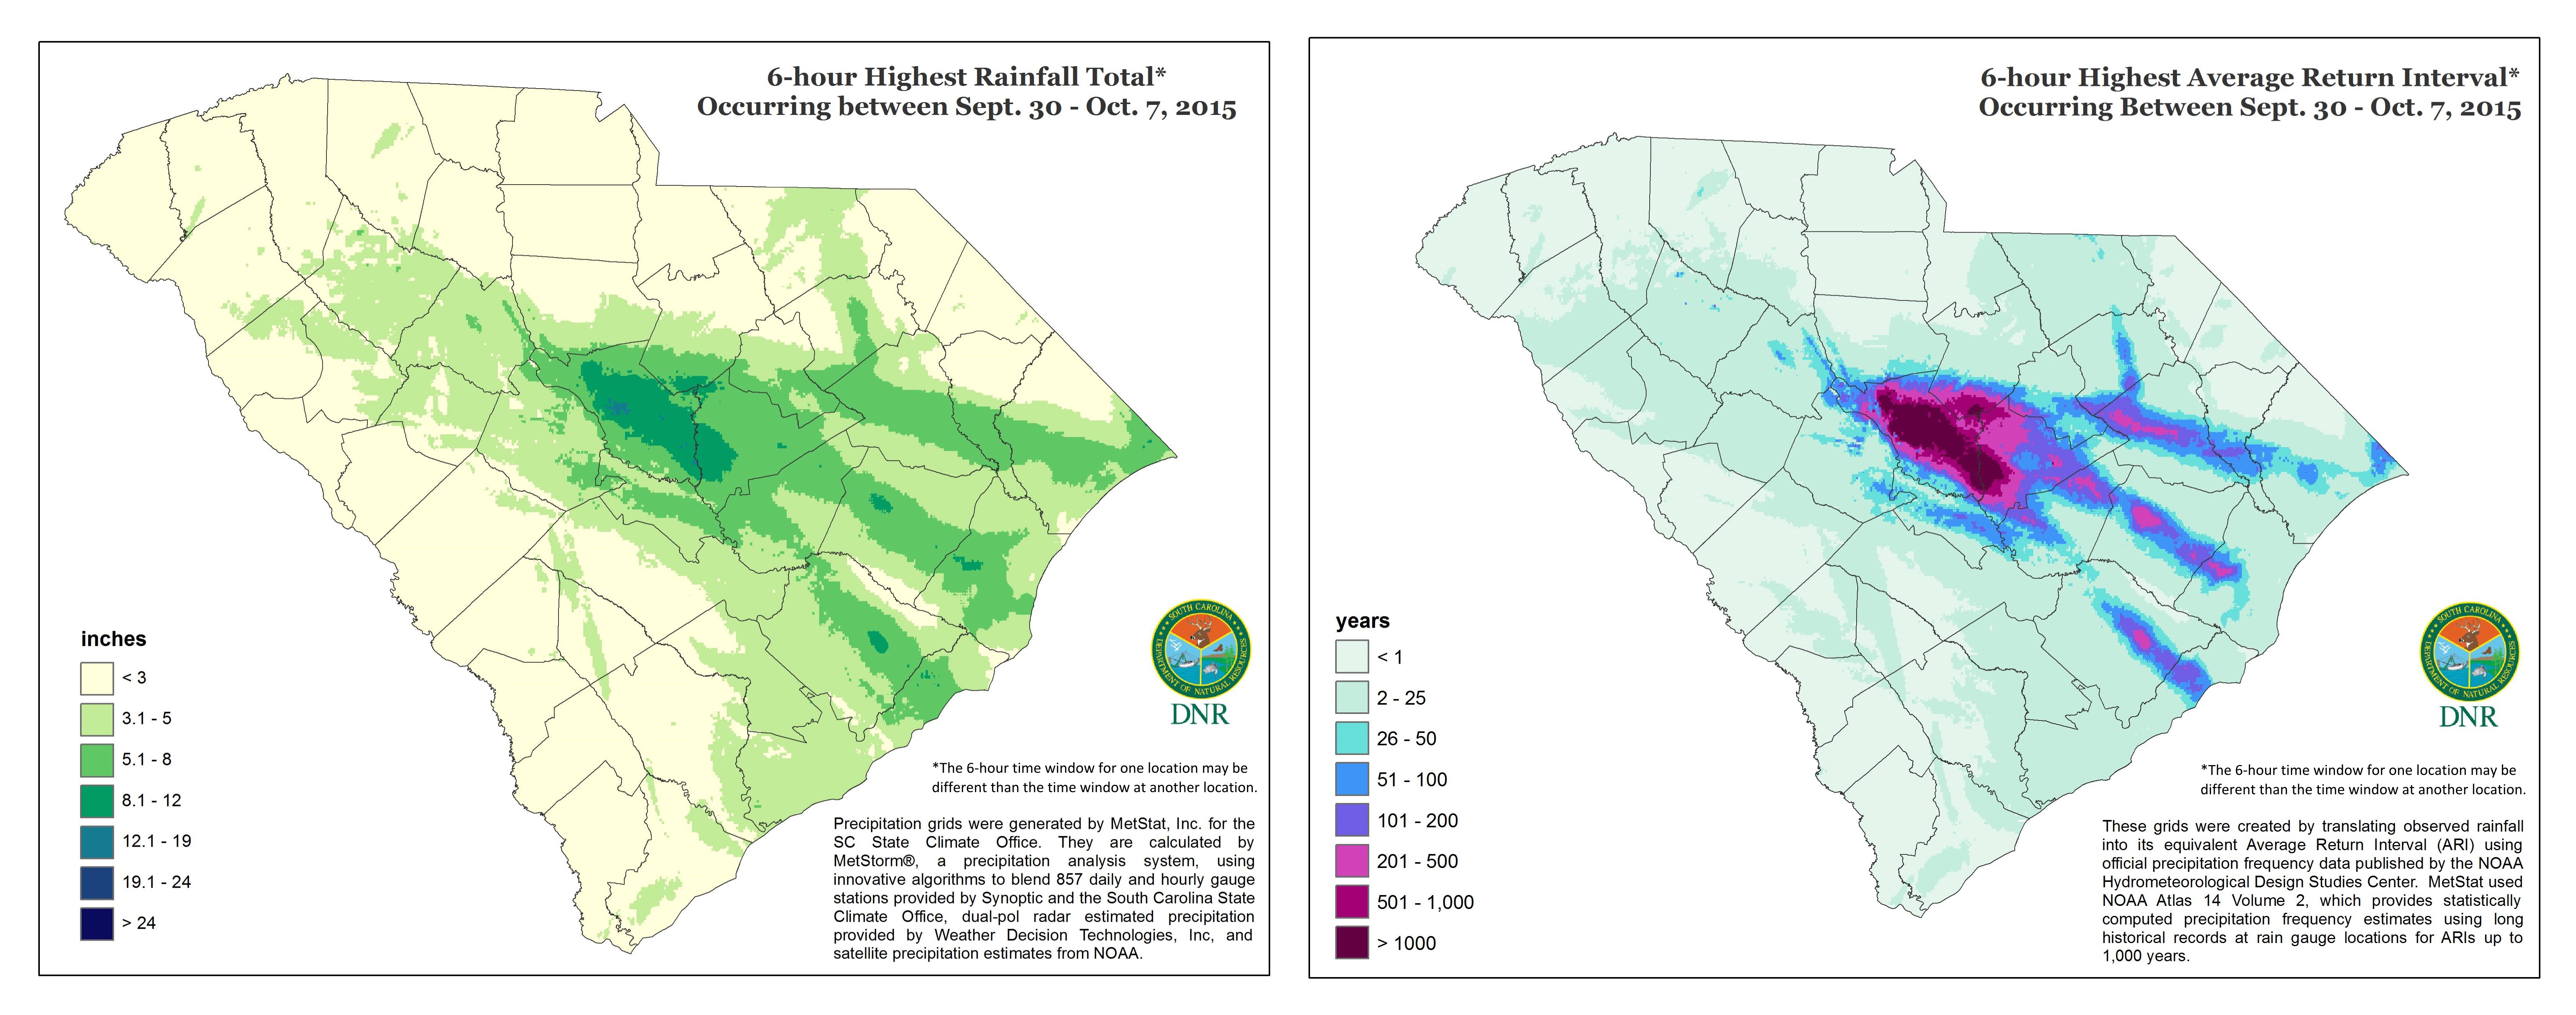


Data from the communities that participate in the program.
View Data Table Download CSV View ArcGIS Map View ArcGIS Online Feature LayerData from FEMA, obtained by SCDNR Flood Mitigation Program. For more about the Flood Mitigation Program, visit their website.